Getting Started
This document explains basics about Observatorium and how to start using and operating it on your environments.
What’s Observatorium
Observatorium allows you to run and operate effectively a multi-tenant, easy to operate, scalable open source observability system. This system will allow you to ingest, store and use common observability signals like metrics, logging and tracing. Observatorium is a “meta project” allows you to manage, integrate and combine multiple well-established existing projects like Thanos, Loki, Tempo/Jaeger etc under a single consistent system with well-defined tenancy APIs and signal correlation capabilities.
As active maintainers and contributors to the underlying projects, we created a reference configuration, with extra software that connects those open source solutions into one unified and easy to use service. It adds missing gaps between those projects like consistency, multi-tenancy, security and resiliency pieces that are needed for a robust backend.
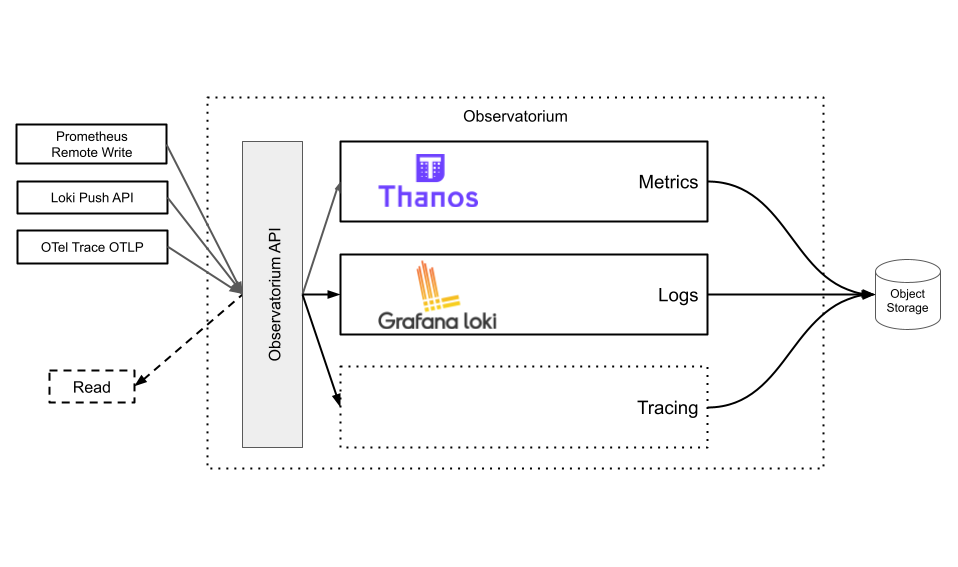
Read more on High Level Architecture docs.
What’s Included
-
Observatorium is primarily defined in Jsonnet, which allows great flexibility and reusability. The main configuration resources are stored in components directory, and they import further official resources like kube-thanos. Some Examples:
- You can see examples of how it can be used in different variations/environments here.
- Our Red Hat Observability Service is also built on Observatorium.
-
We are aware that not everybody speaks Jsonnet, and not everybody has their own GitOps pipeline, so we designed alternative deployments based on the main Jsonnet resources. Operator project delivers Kubernetes plain Operator that operates Observatorium.
NOTE: Observatorium is a set of cloud native, mostly stateless components that mostly does not require special operating logic. For those operations that required automation, specialized controllers were designed. Use Operator only if this is your primary installation logic or if you don’t have CI pipeline.
NOTE2: Operator is in heavy progress. There are already plans to streamline its usage and redesign current CustomResourceDefinition in next version. Yet, it’s currently used in production by many bigger users, so any changes will be done with care.
-
The Thanos Receive Controller is a Kubernetes controller written in Go that distributes essential tenancy configuration to the desired pods.
-
The
APIis the facet of Observatorium service. It’s a lightweight proxy written in Go that helps with multi-tenancy, tenancy (isolation, cross tenancy requests, rate-limiting, roles, tracing). This proxy should be used for all external traffic with Observatorium. -
OPA-AMS is our Go library for integrating Open Policy Agent with Red Hat authorization service for smooth OpenShift experience.
-
up is a useful Go service that periodically queries Observatorium and outputs vital metrics on the Observatorium read path healthiness and performance over time.
-
token-refresher is a simple Go CLI allowing to perform OIDC refresh flow.
Tutorials
Local
This tutorial will help you get started with Observatorium. We will be running the whole Observatorium stack in a local Kubernetes cluster. Observatorium uses OIDC (OpenID Connect) for authentication, so we will deploy our own OIDC provider. After we have Observatorium up and running, we will push some metrics as a tenant from outside the cluster using remote write.
If you just want to run Observatorium locally and get started quickly, take a look at the bash script quickstart.sh.
Prerequisites
-
Clone this repo and change into the local example directory:
git clone https://github.com/observatorium/observatorium.git cd configuration/examples/local -
kubectl: we need to talk to Kubernetes clusters. Check the official documentation on how to install it.
-
git: we will use
gitdownload some dependencies from Github repositories. Check the Installing Git documentation for details. -
kind: we need to run a local Kubernetes cluster to run our stack in. We are going to use KIND (Kubernetes in Docker) for that. You can follow the Getting Started guide to install it.
-
kube-prometheus: installs Prometheus Operator, Grafana, and a few exporters. We will use them to gather and visualize metrics. See prometheus-operator/kube-prometheus for more information.
-
ORY Hydra: OIDC (OpenID Connect) is a popular authentication method often available in your company or major cloud providers. For local purposes we will run our own OIDC provider to handle authentication. We are going to use ORY Hydra for that.
-
Jaeger Operator: our tool of choice for tracing. See Jaeger documentation for more information.
-
OpenTelemetry Operator: we use the OTel Collector to build the distributed tracing component. See open-telemetry/opentelemetry-operator for more information.
-
Token refresher: the token issued by the OIDC providers often have a small validity, but it can be automatically refreshed using a refresh token. As Prometheus doesn’t natively support refresh token flow, we use a proxy in-between to do exactly that for us. Take a look at the GitHub repo to read more about it.
Deploying Observatorium
We will deploy the Observatorium using Kubernetes manifests generated from Jsonnet. To automate everything, we run the quickstart script:
./quickstart.sh
The script will take care of setting up everything. At the end, we can check that all the pods are ready by running kubectl get pods -A.
Writing data from outside
The Observatorium API allows you to push timeseries data using Prometheus remote write protocol. The write endpoint is protected, so we need to authenticate as a tenant. The authentication is handled by the OIDC Provider we started earlier. If you take a look at API secret configuration, you can see that we have configured a single tenant test-oidc. The remote write endpoint is /api/metrics/v1/<tenant-id>/api/v1/receive.
Visualizing data from Observatorium
We are going to use Grafana to query the data we wrote into Observatorium. One is automatically installed by the quickstart script. Check the Grafana service in the monitoring namespace and port-forward into it:
kubectl port-forward -n monitoring svc/grafana 3000:3000
- Now open your web browser and go to
http://localhost:3000. The default username isadminand the default password isadmin. - A Prometheus datasource for the
test-oidctenant should be already created for you.
You can now go the the Explore tab to run queries against the Observatorium API. For example, you can run sum(rate(node_cpu_seconds_total{}[5m])) by (instance) to view the cpu usage (in seconds) of your cluster’s nodes.
Alternatively, you can view one of the pre-installed dashboards, like Prometheus / Overview, to see metrics about Prometheus.